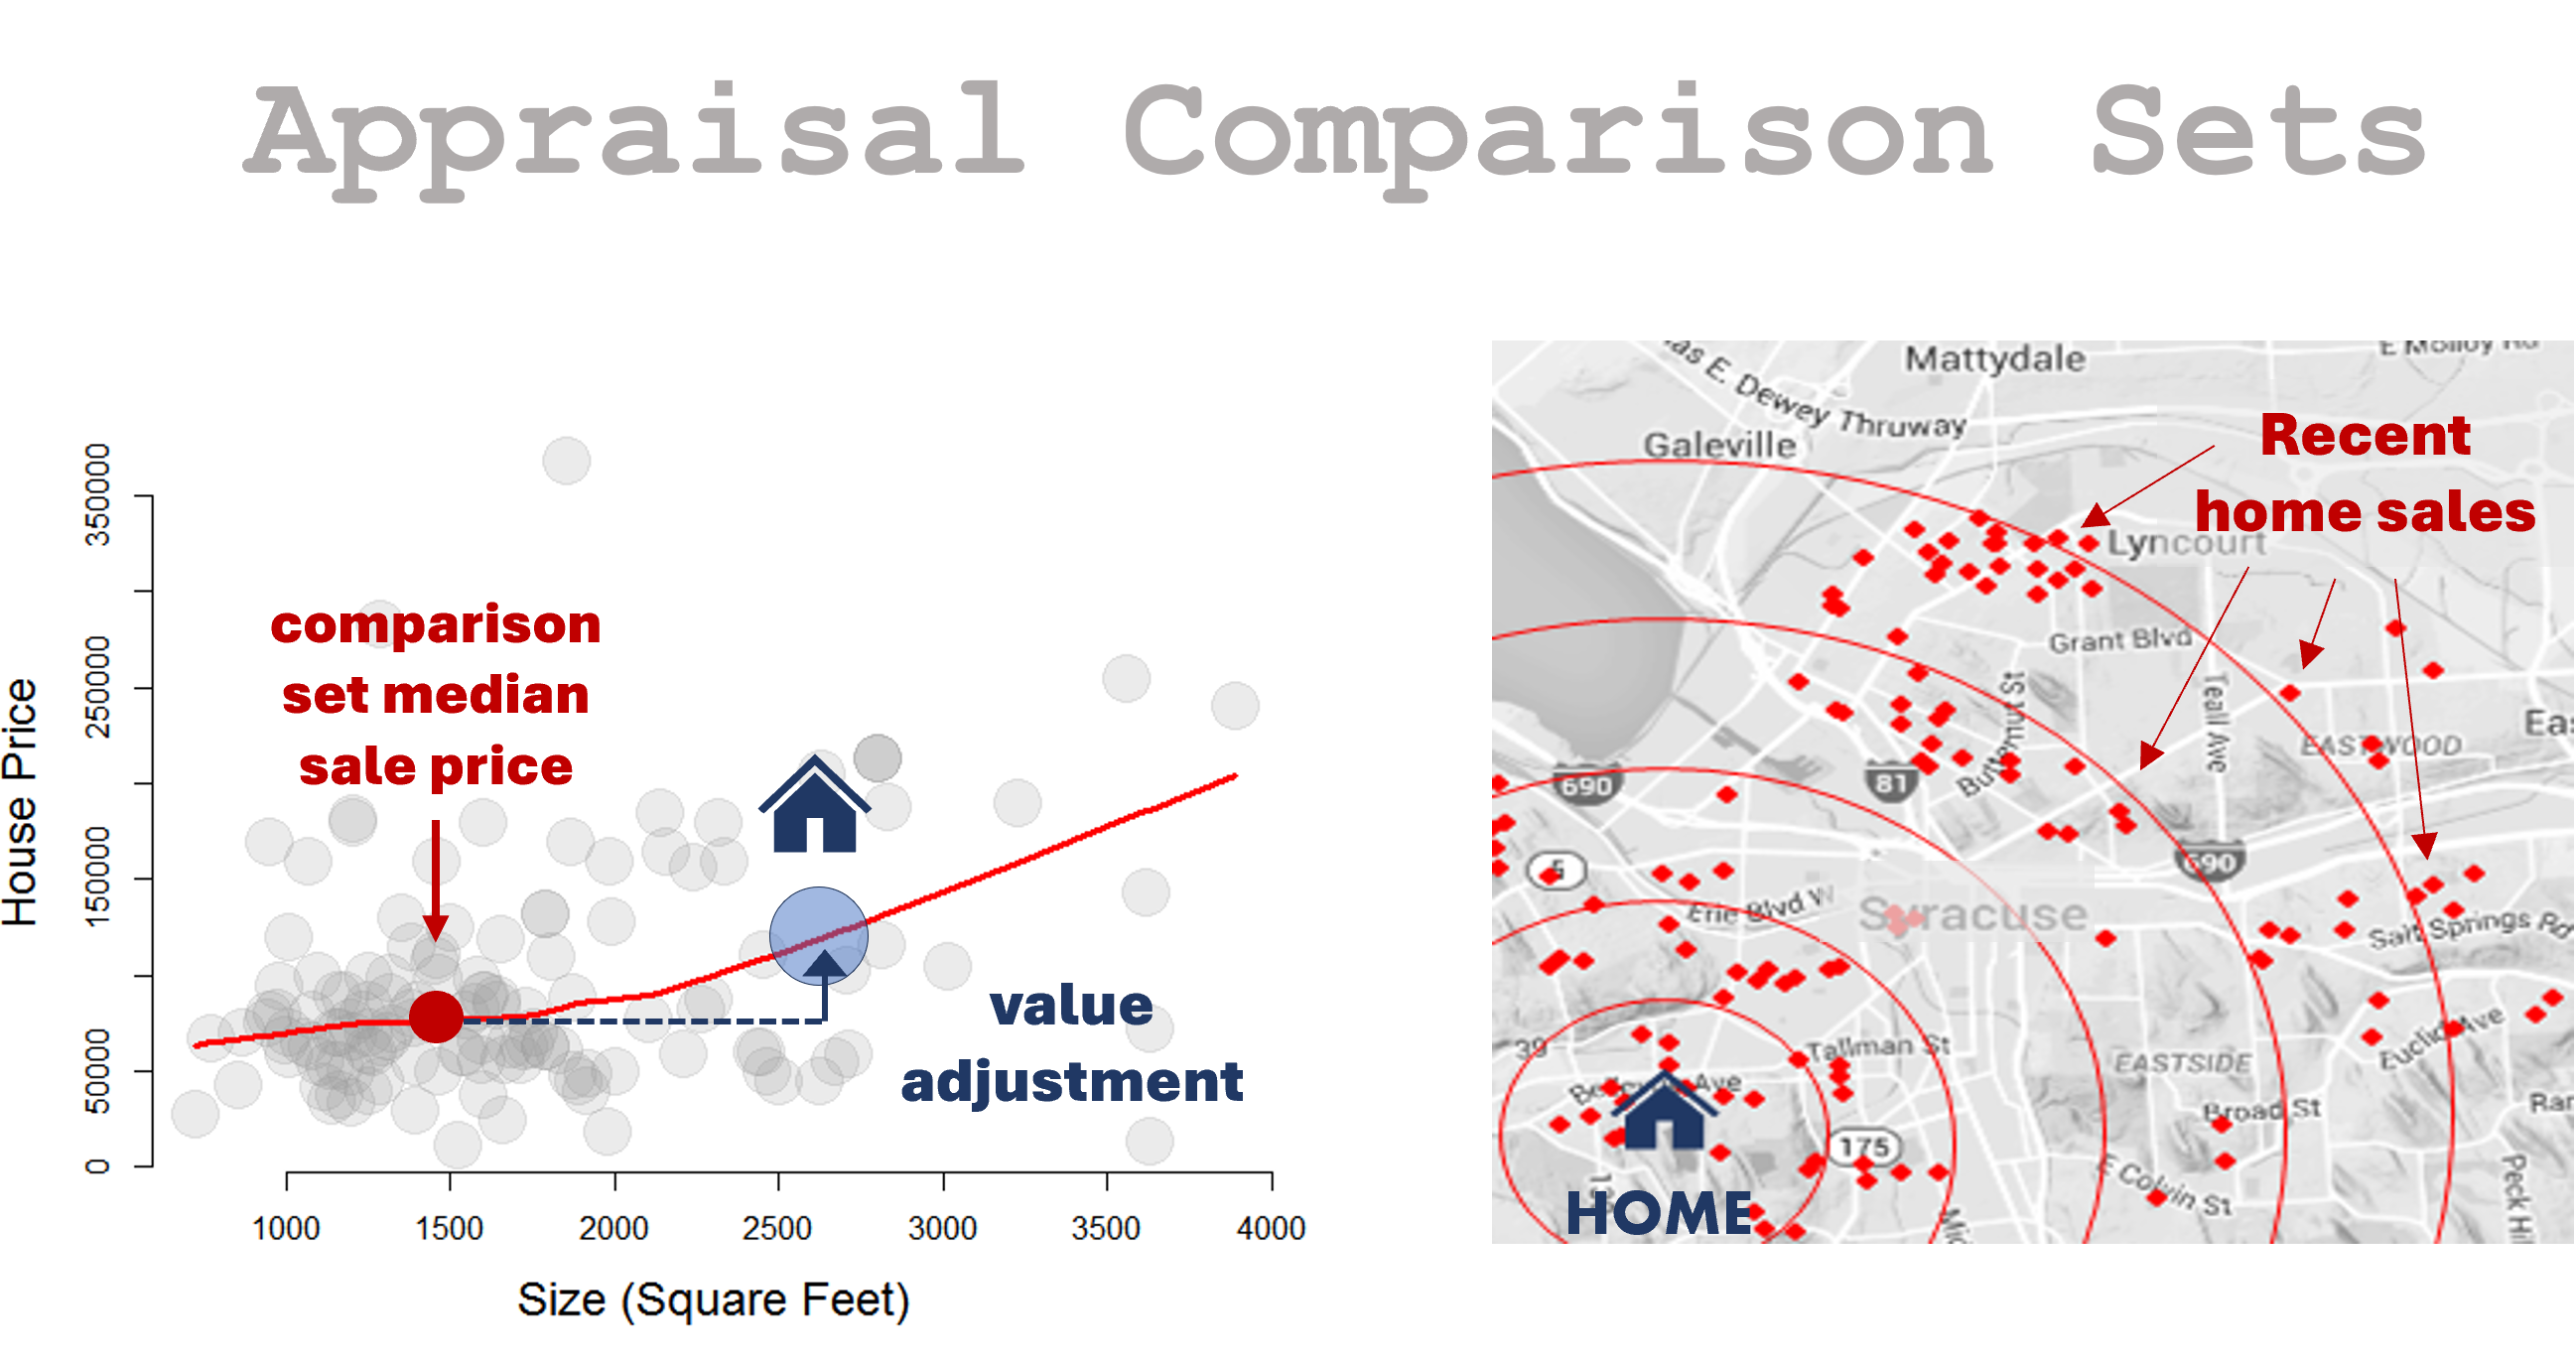
Nonprofit boards commission compensation studies when hiring new executives and conducting performance evaluations. These studies generate a range of reasonable salaries by creating a comparison set of salaries in similar organizations. If a proposed salary falls outside this range, the nonprofit may be over- or under-compensating their executives.
These studies are typically difficult to conduct because they require a substantial amount of data that is currently unavailable in a single digitized format. Many for-profit consulting firms have compiled data, but they charge nonprofits for their appraisal. This current industry standard creates inequities in executive pay. Organizations without financial resources to access high-quality studies are less likely to have the knowledge needed to fairly compensate their executives. Furthermore, a study not performed vigilantly can introduce bias into the compensation estimates and amplify pay disparities.
Our team aims to democratize the process of executive compensation appraisals to provide all nonprofits access to high-quality appraisals without paying large consulting fees. In order to be useful, we need to create a data set that accurately reflects the job market it is trying to appraise. However, the answer to “what is the job market?” is highly flexible depending on what type of nonprofit is being appraised.
For example, if an art museum in New York City is hiring a new CEO, we want to compare their proposed compensation to compensations from art museums in other large cities like San Francisco, Chicago, or Boston. But if a small animal shelter in Jackson, Wyoming is hiring a new CEO, we want to compare their proposed compensation to other small animal-related nonprofits located in the Rocky Mountains. Before we can appraise new nonprofits CEO compensations, we need to build an accurate data base of current CEO compensations. This requires knowing for essential factors for every nonprofit in the U.S. (1) who the CEO is, and (2) how much they are being paid.


While these seem like straightforward questions, finding the answers is by no means a simple task. Every nonprofit is annually required to file form 990 with the IRS, and the IRS makes these fillings publicly available. But just because the data is available, does not mean is it easy to use.
These data are not standardized and require extensive cleaning and classification. More problematic, some small nonprofits file Form 990-EZ, a simplified version of Form 990, which does not contain nearly as much detailed information. This leaves us with an incomplete picture for many organizational attributes.
Another issue is simply identifying who the CEO is. The language used from nonprofit to nonprofit is highly nonstandard. Some nonprofits directly list a Chief Executive Officer, while many list director, president, or other titles to describe their organization leader. Simply identifying which person serves performs the function the CEO is a task in-and-of itself. See our project on name classifications for more details. [LINK HERE TO NAME CLEANING PROJECT]
When creating an appraisal, we only want to consider other organizations that are similar to the specific nonprofit being appraised. The challenge in this project is to define what it means for two nonprofits to be similar. Nonprofits can be compared on multiple characteristics such as operating size, number of employees, amount of financial support, geographic location, intended beneficiaries or services, and scope of mission. For our comparison between nonprofits, we choose to focus on three aspects: annual expenses, geographic location, and scope of mission.
We selected annual expenses as a proxy for organizational size since it is typically more stable than annual income for nonprofits. Often nonprofits will receive grants that are paid to it all at once but are spent over several years. We consider expenses to avoid these spikes in income from grants.
For geographical characteristics we consider what state/territory and the type of city (metropolitan, suburban, small town, rural) the nonprofit is located in. And while geography is an important aspect to account for, it is not enough on its own. Let’s consider Wave Hill Public Garden and Cultural Center located in the Bronx. It is only seven miles away from the Bronx River Art Center, A SMALL educational art studio. Although these two organizations are located in the same geographic region, they are hardly comparable because they have different goals. It is more appropriate to compare Wave Hill to the Santa Fe Botanical Garden in New Mexico or the Cleveland Botanical Garden in Ohio since these organizations are all public gardens in major metropolitan cities.
Quantifying the similarity of nonprofit missions is the most challenings part of this project. The IRS uses the National Taxonomy of Exempt Entities (NTEE) Codes to categorize a nonprofit’s scope of mission. The NTEE system contains a hierarchical classification system that has over 650 basic codes and thousands of more specialized codes. In the plot below we have included the basic codes and their hierarchical structure. You can click on the nodes to explore how the codes are nested in this structure. To learn more about NTEE codes, see [LINK TO NTEE CODES STORY].
We use this hierarchical structure to construct the distance between this missions of nonprofits. For example, a nonprofit involved in youth violence and crime prevention (code I21) is very close to a nonprofit assisting in general crime prevention (code I20). It is moderately close to a nonprofit providing prison alternatives (code I44), moderately far from a vocational rehabilitation organization (code J30), and very far from a advocacy organization for physical and earth sciences (code U21).
Let’s walk though some examples highlighting how changing the definition of “other similar organizations” can impact the nonprofits included in the appraisal process. Say Nonprofit X in Jacksonville, Florida provides social services to parents and families, and they annually spend about $3.5 million. First, we define nonprofits that are similar to Nonprofit X as all other nonprofits located in Flordia. Below we have a map of all of these organizations:

While it is nice to have all the nonprofts used in the apprasial process to be only from Florida, there is a wide variety of industry types represented. Many of these organizations are not involved in human services work and as mentioned before, we only want to include nonprofits that have a smiliar mission to Nonprofit X. For example, a nonproft that does animal work is not helpful to appraise the CEO compensation for our nonprofit that does social service work. We can see in the graph below that most organizations selected under this definition of “similar” have a very small geographic distance from Nonprofit X, but also have a very large mission distance.

Since it is important to only include nonprofits that do similar work to Nonprofit X, let’s instead define “other similar organizations” as nonprofits that do general human services work located anywhere in the continental U.S.

This definition alleviates our earlier problem. We can see in the graph above most of these nonprofits have a small mission distance from Nonprofit X. However, by considering all nonprofits in the continental U.S. most of them have a very large geographic distance from Nonprofit X. A nonprofit that does crime prevention work in rural Montana probably isn’t relevant for appraising Nonprofit X even though they both do genral human services work.

We need to find a compromise between two defintions. We only want our appraisal to include organizations whose geographic and mission values are close to Nonprofit X. Now we will add the a third definition of “other similar organizations” that only human services nonprofits in metropolitan areas of states in the southeast U.S. We can see from the plots below that the nonprofits in this set are much closer to Nonprofit X both in terms of their geography and their respective missions!


Once we have a set of nonprofits with our desired characteristics we can use them to generate a CEO comepensation appraisal for Nonprofit X of $64,756 to $384,039.
We can appraise the CEO compensation of any nonprofit by creating a set of similar organizations based on the three criteria of.
For more information on the exact method used to calculate this appraisal, see the compensator R package documentation. This free and easy to use tool allows users to quickly compare nonprofits based upon annual expenses, geographic location, and scope of mission. We then use these compaisons to aprraise the CEO compensation of any nonprofit.
Payroll Taxes
This data story outlines the process for estimating the amount of payroll taxes nonprofits pay annually.
Introducing the nccsdata Package
This story demos three functions from the nccsdata package.